3. Demand and Supply
3.1. Demand, Supply, and Equilibrium in Markets for Goods and Services
3.1.1. Demand for Goods and Services
Economists use the term demand to refer to the amount of some good or service consumers are willing and able to purchase at each price. Demand is based on needs and wants—a consumer may be able to differentiate between a need and a want, but from an economist’s perspective they are the same thing. Demand is also based on ability to pay. If you cannot pay for it, you have no effective demand.
What a buyer pays for a unit of the specific good or service is called price. The total number of units purchased at that price is called the quantity demanded. A rise in price of a good or service almost always decreases the quantity demanded of that good or service. Conversely, a fall in price will increase the quantity demanded. When the price of a gallon of gasoline goes up, for example, people look for ways to reduce their consumption by combining several errands, commuting by carpool or mass transit, or taking weekend or vacation trips closer to home. Economists call this inverse relationship between price and quantity demanded the law of demand. The law of demand assumes that all other variables that affect demand (to be explained in the next module) are held constant.
An example from the market for gasoline can be shown in the form of a table or a graph. A table that shows the quantity demanded at each price, such as Table, is called a demand schedule. Price in this case is measured in dollars per gallon of gasoline. The quantity demanded is measured in millions of gallons over some time period (for example, per day or per year) and over some geographic area (like a state or a country). A demand curve shows the relationship between price and quantity demanded on a graph like Figure, with quantity on the horizontal axis and the price per gallon on the vertical axis. (Note that this is an exception to the normal rule in mathematics that the independent variable (x) goes on the horizontal axis and the dependent variable (y) goes on the vertical. Economics is not math.)
The demand schedule shown by Table and the demand curve shown by the graph in Figure are two ways of describing the same relationship between price and quantity demanded.
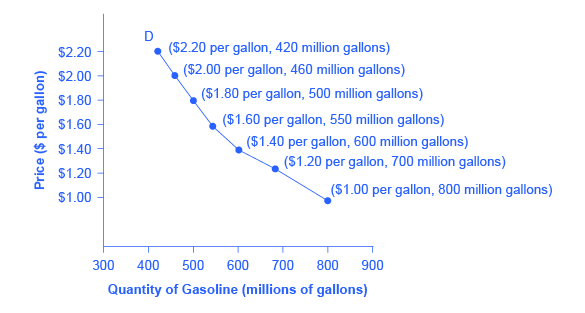
Fig. 3.1 The demand schedule shows that as price rises, quantity demanded decreases, and vice versa. These points are then graphed, and the line connecting them is the demand curve (D). The downward slope of the demand curve again illustrates the law of demand—the inverse relationship between prices and quantity demanded.
Demand curves will appear somewhat different for each product. They may appear relatively steep or flat, or they may be straight or curved. Nearly all demand curves share the fundamental similarity that they slope down from left to right. So demand curves embody the law of demand: As the price increases, the quantity demanded decreases, and conversely, as the price decreases, the quantity demanded increases.
Confused about these different types of demand? Read the next Clear It Up feature.
Warning
IS DEMAND THE SAME AS QUANTITY DEMANDED? In economic terminology, demand is not the same as quantity demanded. When economists talk about demand, they mean the relationship between a range of prices and the quantities demanded at those prices, as illustrated by a demand curve or a demand schedule. When economists talk about quantity demanded, they mean only a certain point on the demand curve, or one quantity on the demand schedule. In short, demand refers to the curve and quantity demanded refers to the (specific) point on the curve.
3.1.2. Key Concepts and Summary
Note
Economics seeks to solve the problem of scarcity, which is when human wants for goods and services exceed the available supply. A modern economy displays a division of labor, in which people earn income by specializing in what they produce and then use that income to purchase the products they need or want. The division of labor allows individuals and firms to specialize and to produce more for several reasons:
- It allows the agents to focus on areas of advantage due to natural factors and skill levels;
- It encourages the agents to learn and invent;
- It allows agents to take advantage of economies of scale. Division and specialization of labor only work when individuals can purchase what they do not produce in markets. Learning about economics helps you understand the major problems facing the world today, prepares you to be a good citizen, and helps you become a well-rounded thinker.
3.1.3. Self-Check Questions
Todo
What is scarcity? Can you think of two causes of scarcity?
Todo
Residents of the town of Smithfield like to consume hams, but each ham requires 10 people to produce it and takes a month. If the town has a total of 100 people, what is the maximum amount of ham the residents can consume in a month?
Todo
A consultant works for $200 per hour. She likes to eat vegetables, but is not very good at growing them. Why does it make more economic sense for her to spend her time at the consulting job and shop for her vegetables?
Todo
A computer systems engineer could paint his house, but it makes more sense for him to hire a painter to do it. Explain why.